Market Summary · Enterprise insurance · Shipped AI feature
Turning fragmented placement data into an operational decision workspace
Centralizing market responses, co-insurance relationships, and broker actions inside Marsh PPM
Brokers and senior stakeholders relied on spreadsheet-based reporting, manual cross-referencing, and disconnected workflows to understand market responses and placement activity.
I led the UX/UI design of a centralized Market Summary experience inside Marsh's Placement and Policy Management platform — bringing market responses, placement details, co-insurance relationships, and operational actions into one workflow, and designing LenAI, the AI extraction feature that turns broker quote documents into structured, reviewable market data. It shipped as part of the Market Summary module.
Approached with the Double Diamond
Overview
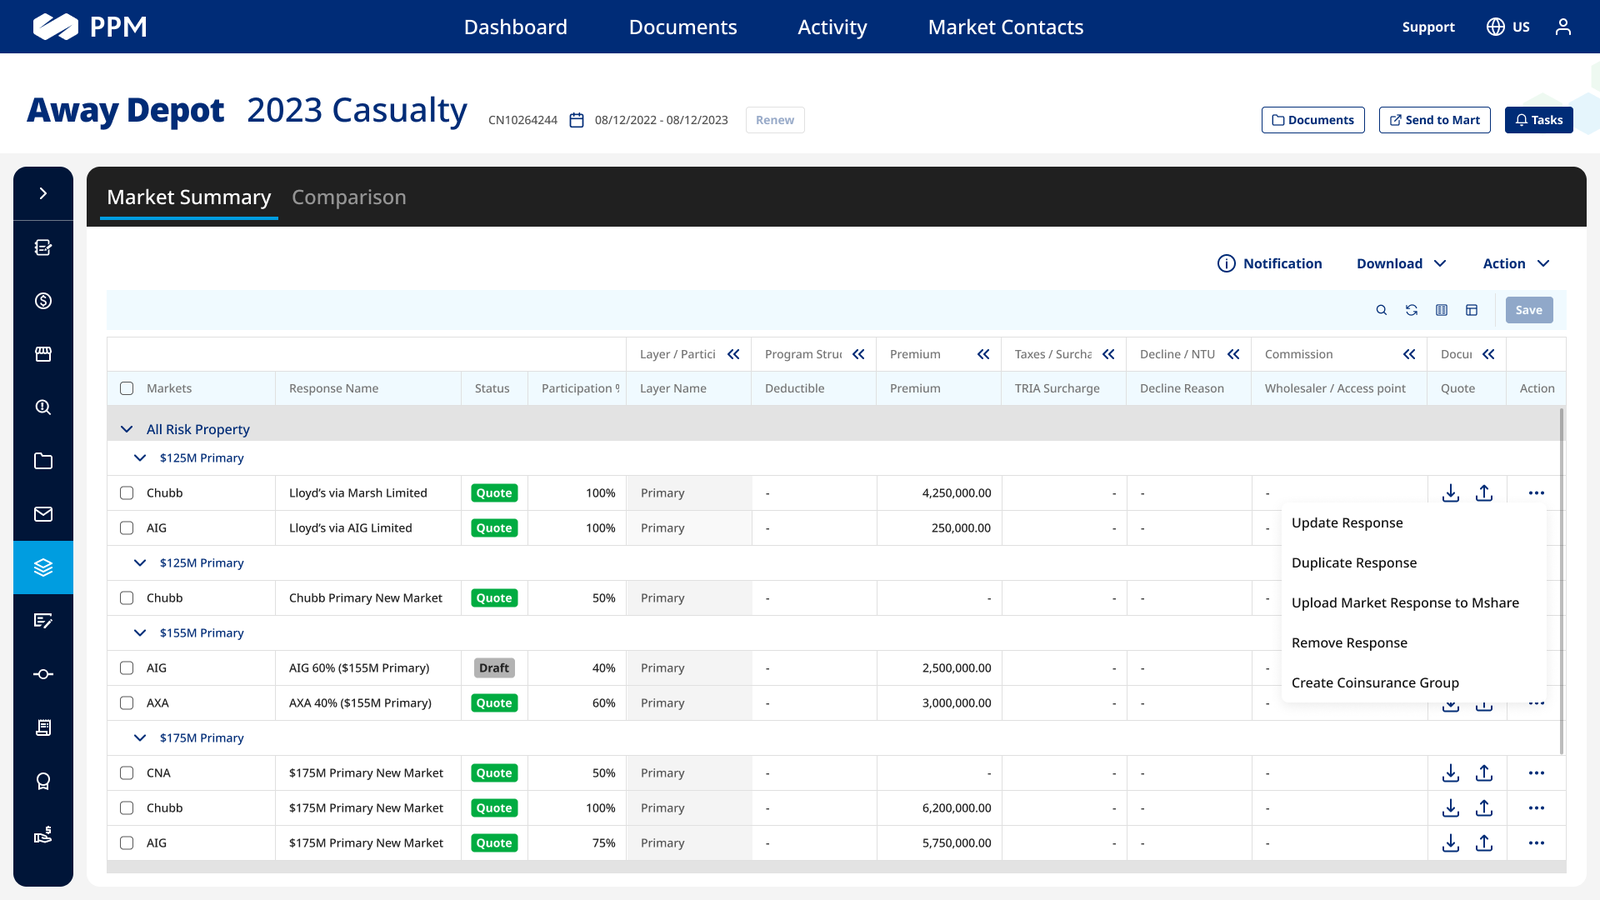
PPM supports the whole placement and policy lifecycle — renewal, submission, binding, invoicing, policy, endorsements — so Market Summary is part of an operational platform, not an isolated reporting dashboard. The existing workflow leaned on spreadsheet-style information management: users located information, compared responses, worked out placement status, then moved to another workflow to act on it. That made the brief bigger than redesigning a grid.
The problem
Users needed answers, not another spreadsheet
The existing experience exposed data, but left users to do the work of turning it into understanding. Information was fragmented across documents, spreadsheets, and system records — the same operational problems the wider PPM documentation identifies: unstructured information transfer, email attachments, local spreadsheet tracking, duplicate client and placement data.
The old path: Excel and documents → search → filter → cross-reference → interpret → return to PPM → act. The opportunity was not to reproduce Excel inside PPM, but to expose the relationships and actions behind the data: Market Summary → filter → inspect → compare → act.
The value wasn't displaying more information. It was reducing the work required to turn information into a decision.
Discovery
Three problems drove the redesign
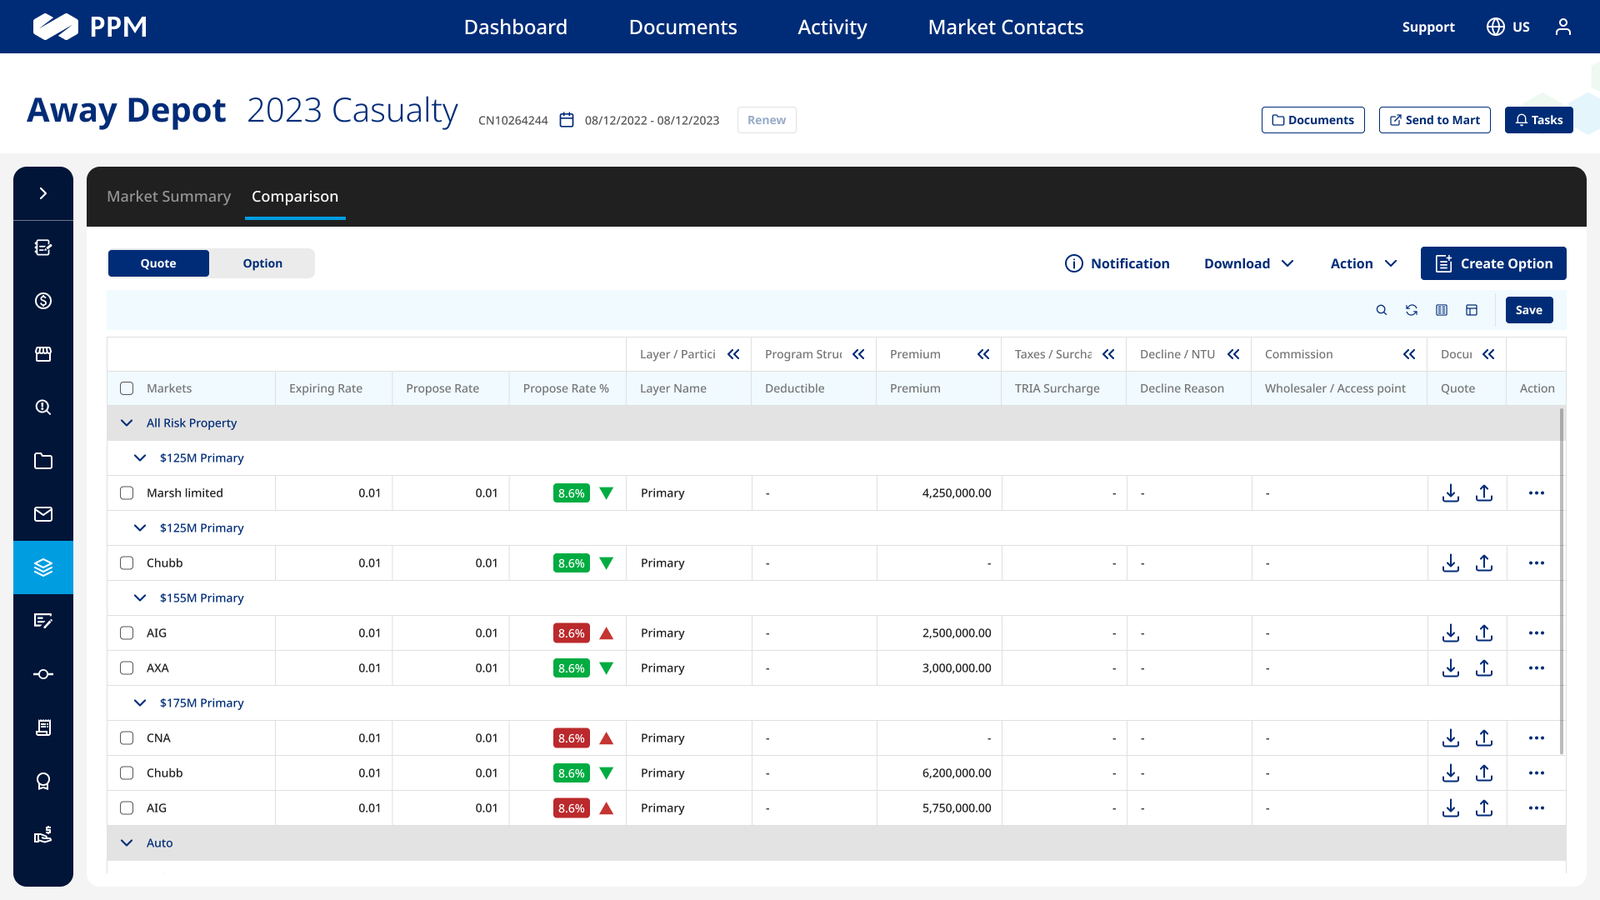
I combined stakeholder and user interviews with workflow analysis, reviews of the spreadsheets people had built for themselves, the business requirements, and competitive patterns from complex enterprise data products. Three problems accounted for most of the friction — and each pointed at a specific design response.
Information density
Users needed substantial placement information, but presenting every attribute with equal weight made the experience impossible to scan. → Progressive disclosure.
Finding the right response
Large placements could hold many responses, making navigation and comparison progressively harder. → Search and contextual filters across status, date, and product.
Relationships were more complex than rows
A market response could be a parent/lead with several children/followers. Treating each as an independent table row would hide the structure that matters. → Hierarchical responses.
Design principles
Designing hierarchy into the data
Three principles governed every subsequent decision, and they're the reason the result reads as a workspace rather than a report.
Clarity over clutter
Prioritize information hierarchy instead of exposing every field at once.
Relationships over records
Represent lead/follower and parent/child structure rather than treating market responses as independent rows.
Action in context
Let users move from understanding a market response to acting on it without leaving the workflow.
Design reasoning
Problem, decision, interface
Each discovery finding resolved into a structural decision, and each decision produced a specific part of the interface.
Complex market relationships
A single placement could represent an interconnected market structure — one lead insurer with multiple followers — that a flat table would flatten into unrelated rows.
Parent/lead and child/follower hierarchy
The lead response becomes the primary row, carrying aggregate information, with followers revealed on expansion. The relationship is visible without the user reconstructing it.
Too much information at once
Decision-critical information competed with detail that only mattered occasionally.
Progressive disclosure and collapsible detail
Show what drives the decision first; let users expand into full market response detail only when the question requires it.
Insight disconnected from action
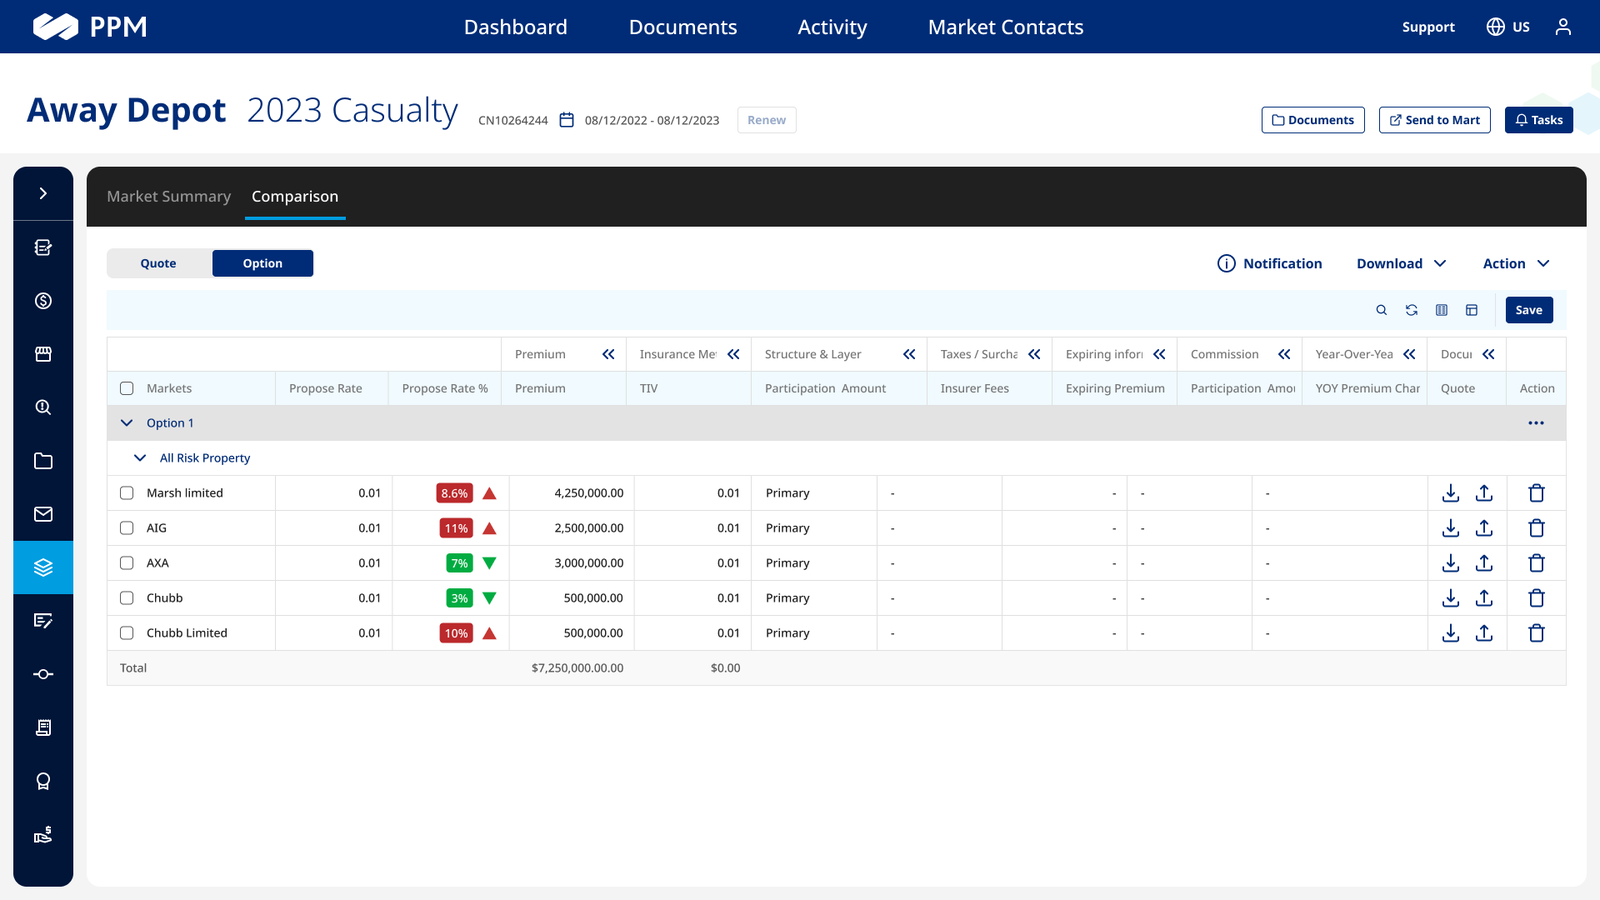
Understanding a response and acting on it lived in different places, so users left the workflow to do anything about what they'd found.
Contextual actions in the grid
View details, renew, and do-not-renew available on the row itself, alongside filtering across status, date, and product line.
Co-insurance
One placement could be an interconnected market structure
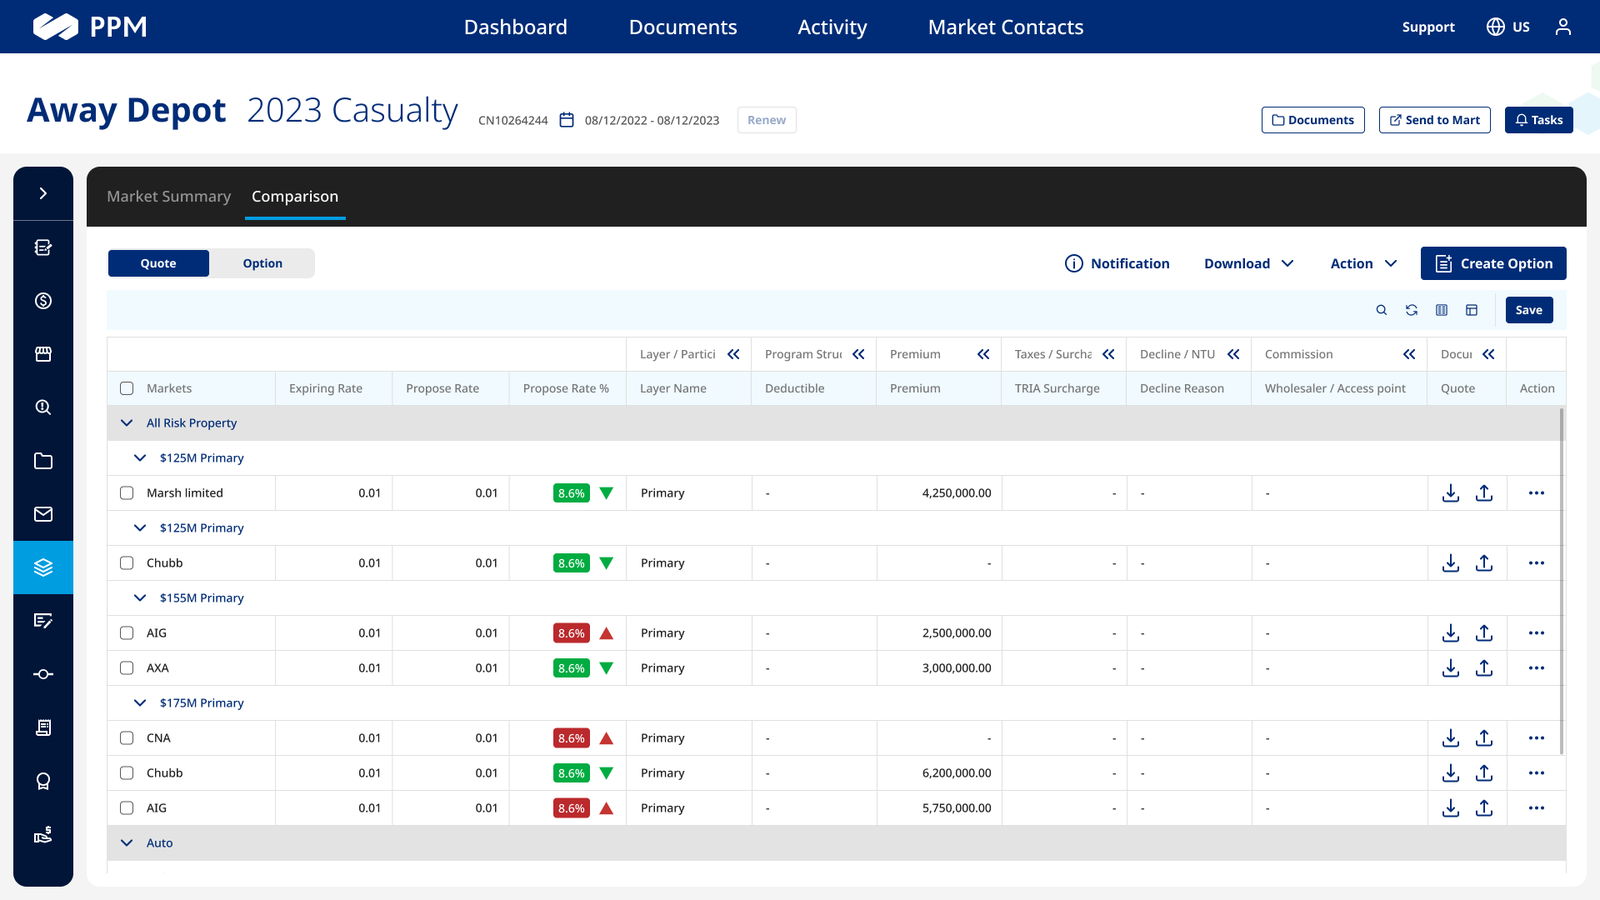
Supporting co-insurance and subscription placements across territories was the hardest part of the work. The requirements called for lead/follower status, participation percentages, capacity, and premium — with dependent calculations and synchronization between related responses. Edits to a linked parent field can proportionally update its followers; edits at follower level roll back up into the parent aggregate.
The UX question was how to expose those relationships and calculations without forcing a broker to understand the underlying data model.
Hierarchy
Lead/parent as the primary record, followers nested beneath it — the structure visible at a glance, expandable on demand.
Progressive disclosure
Aggregate placement view preserved while individual participants stay one interaction away.
Synchronized editing
Dependent values update across related responses, so the interface maintains the relationship rather than asking the broker to.
Validation
What testing showed
Tested with six participants from PMO and Finance, working through common reporting tasks against the previous spreadsheet-based process.
With six participants, I treated these as directional evidence rather than quantitative validation — enough to justify the direction and the build, not enough to publish as a performance claim. Feedback also produced the next round of requests: saved views, downloadable reports, and predictive insight.
LenAI — AI-assisted quote extraction
Brokers upload a quote instead of manually rebuilding its data
Once Market Summary centralized the operational workflow, the next friction became visible: the information brokers needed already existed inside quote documents, but still had to be interpreted and typed into PPM.
That became LenAI — an AI extraction feature I designed into the Market Summary module, which shipped inside PPM. It turns broker-uploaded quotes into structured market-response data: extracting insurer, issuing paper, coverage, deductible, layer, limits, participation, and premium, then matching those against real PPM entities, because a string in a document and a valid system entity are not the same thing. For subscription quotes it can also propose the lead/follower structure and map participation accordingly.
Upload quote
One or more quote documents attached to the placement.
Extract market terms
Insurer, coverage, status, deductible, layer, limits, participation, premium.
Match against PPM
Extracted entities mapped to real market responses, insurers, issuing papers, and coverages.
Structure the summary
Document content converted into Market Summary fields and relationships, including proposed lead/follower structure.
Human review
Every value shows what was extracted, where it came from, its confidence, and Accept / Edit / Reject.
Update Market Summary
Only approved information populates the corresponding records.
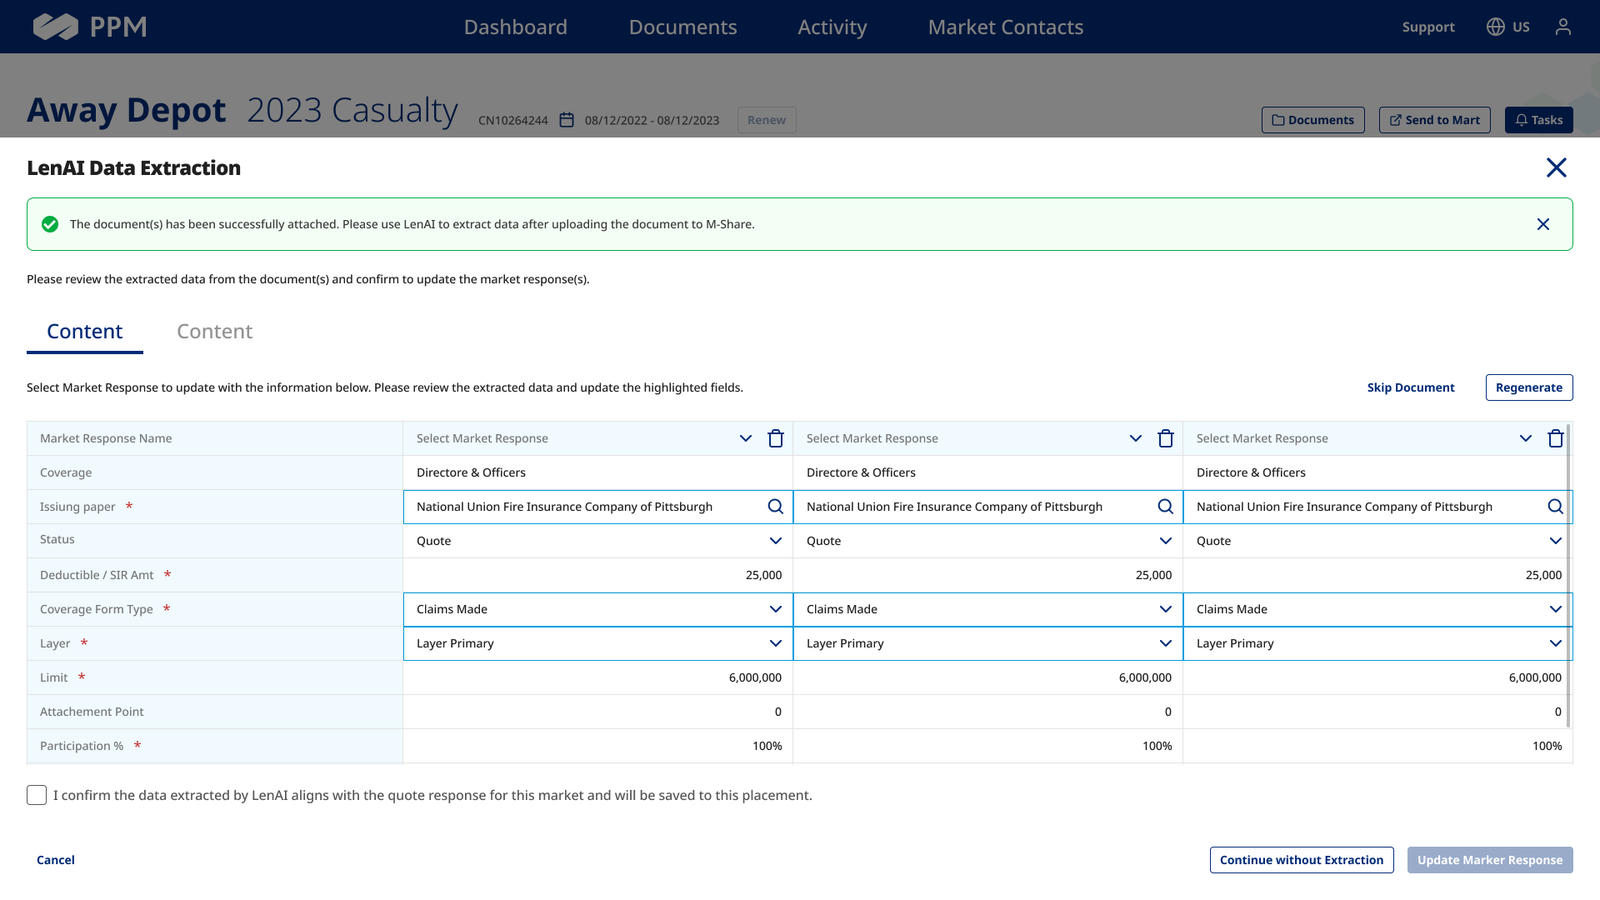
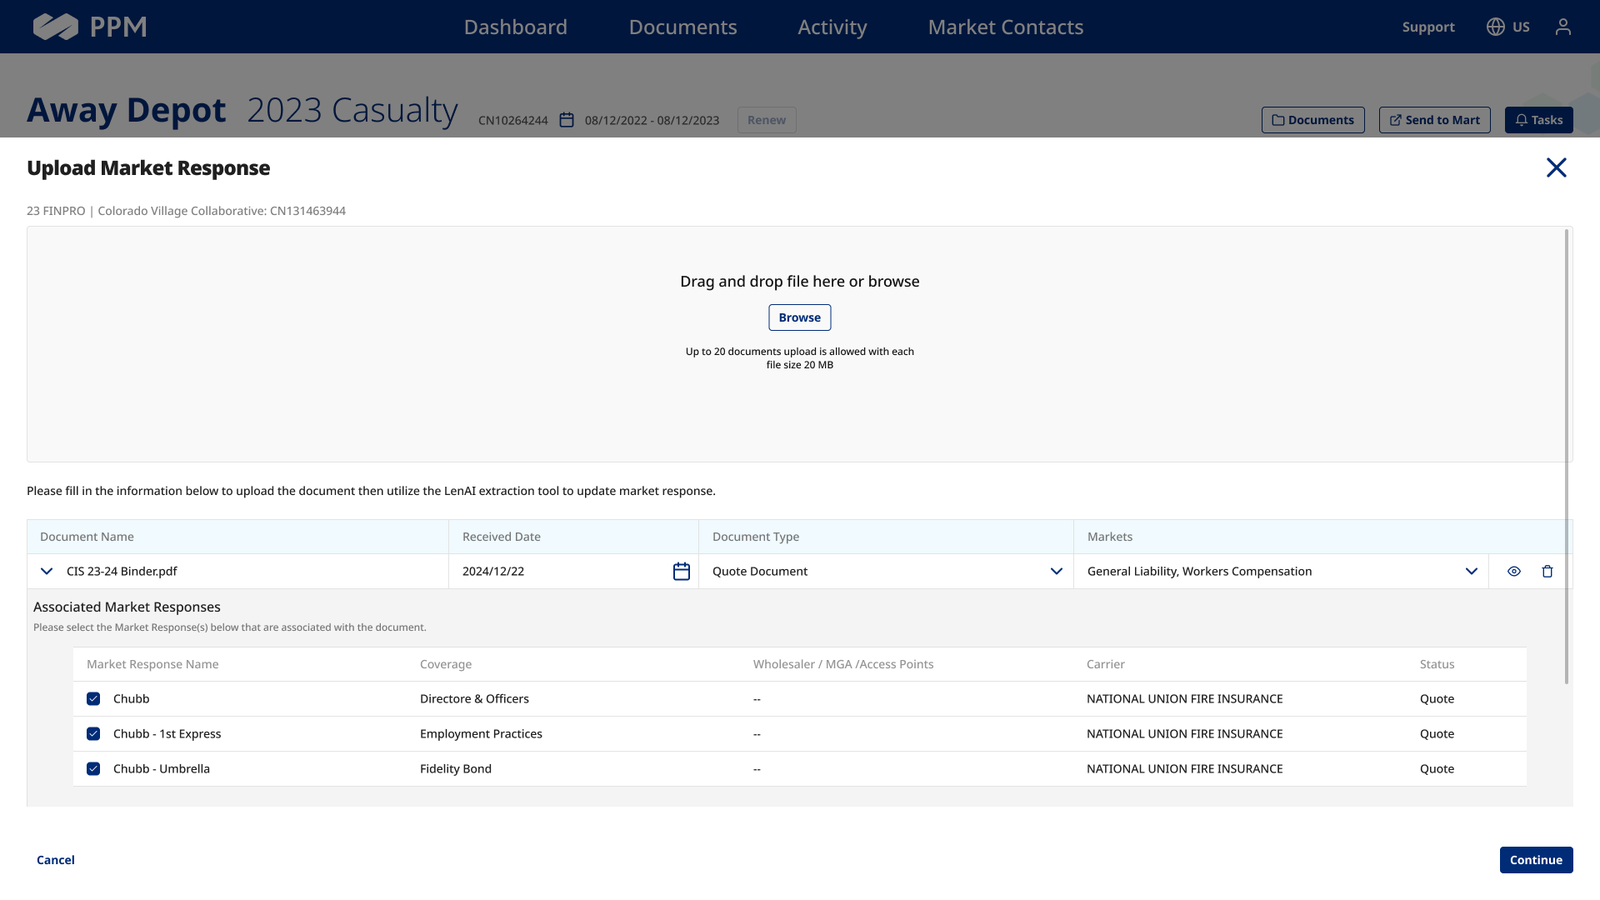
The result is document → structured data → broker validation → operational workspace, replacing document → manual interpretation → manual entry → cross-check → spreadsheet → PPM.
Designing AI for trust
AI reduces document-to-data work; brokers keep judgment over the response
In a placement workflow the risk isn't that AI is slow — it's that a wrong figure enters an operational record and nobody notices. So the design work sat in traceability and uncertainty, not extraction accuracy. Selecting an extracted value reveals where it came from in the quote — “$2.5M limit · page 4, coverage terms.” Ambiguous matches surface rather than resolve silently — “issuing paper: potential match, review required.” And the system validates before import: participation totalling 95% is flagged for review, not quietly accepted.
Source traceability
Every extracted value links back to its location in the source quote.
Uncertainty is visible
Potential matches are surfaced for review instead of being silently resolved.
Human control
Accept, edit, reject, or regenerate — before anything updates operational data.
Validation before import
Conflicts like participation totals that don't reconcile are caught ahead of the update.
Extraction and human-reviewed import shipped first. The roadmap beyond it runs through deeper entity matching, relationship detection for co-insurance structures, and comparison intelligence that highlights meaningful differences across quotes. I'd stop short of “AI recommends which insurer to choose” — document interpretation, comparison, and anomaly detection make a credible product direction, while the consequential decision stays with the broker.
Reflection
The hardest part wasn't designing a better table. It was designing the relationships behind it. This work reinforced that enterprise data products become useful when the interface reflects how users actually reason about the domain — which meant translating market responses, lead/follower relationships, participation, aggregation, and downstream dependencies into something brokers could use without reconstructing the system model in their heads. It also shaped how I approach AI: automate the repetitive interpretation, keep the consequential decisions visible, traceable, and human.
Outcome
Centralized workspace
Market Summary delivered inside PPM, replacing spreadsheet-based placement reporting.
Faster in testing
5 of 6 participants completed reporting tasks in roughly half the time.
LenAI shipped
AI quote extraction integrated into the Market Summary module, with human review as a required step.